- Change-Inference Based on Distance-Related Functionals: Wasserstein and Beyond (2024-2027)
Research project funded for three years by Deutsche Forschungsgemeinschaft (DFG).

Project Partner: Prof. Fabian Mies, Delft University of Technology
The project aims at establishing a comprehensive methodology for statistical change- point methods based on Wasserstein distances and derived functionals. The developed methods will be able to detect variations in the distribution of a data stream which go beyond classical moments, thus enabling finer analyses of characteristics such as the tail behaviour, peakedness or multi-modality. This is relevant for applications in diverse fields such as finance and environmetrics, where a change in terms of such a char- acteristic may indicate a structural economic break, the onset of a financial turmoil, or a tipping-point of a climate process.
Related publications containing project results:
[1] Scholz, F. and Steland, A. (2024). On the weak convergence of the function-indexed sequential empirical process and its smoothed analogue under nonstationarity. Preprint, arXiv:2412.0136. https://doi.org/10.48550/arXiv.2412.01635
- A New Framework for Inference of Covariance Estimators of High-Dimensional Time Series and Applications (2019-09/2022)
The project continues our research on inference for high-dimensional time series and their applications. We especially study methods based on quadratic forms. For a high-dimensional time series inference on the covariance structure matters in various application areas such as sensor monitoring, environmetrics or econometrics.
Project partner: Rainer v. Sachs (UC Louvain)Research project funded for three years by Deutsche Forschungsgemeinschaft (DFG).

Published project results, [1,3], extend the proposed methodology based on bilinear forms of the sample covariance model to general multivariate linear time series, vector autoregressions, a wide range of factor models and a class of spiked covariance models. The dimension is allowed to increase without imposing a constraint on its growth. For change testing unweighted as well as weighted CUSUM procedures are studied. For standardization estimation of the long-run-variance in the time domain is considered and, as an alternative, self-standardized CUSUM statistics. In addition, the CUSUM maximized over all possible subsamples is examined, which is sensitive to periods of change wherever located.
In [4] the theory has been extended to a class of nonlinear nonstationary time series of growing dimension drawing on recent results on Gaussian approximations with optimal rate with respect to the dimension for independent observations. Previous results on Gaussian approximations of vector time series were limited to fixed dimension. A multiplier bootstrap is established and the application to change-point testing problems is discussed.
A further stream of research extends the idea to reduce the dimensionality by considering projection statistics to the frequency domain, [5]. This has important applications in areas such as neuroscience, finance and material science, where the starting point for analyses is often the time-frequency representation of the data. For a class of locally stationary vector time series change-point testing based on bilinear forms of (integrated) lag-window estimators of spectral density matrices are established. The results cover spectral average statistics and, more generally, nonlinear spectral averages. By studying a sampling design based on local samples the approach is able to handle big data settings. To allow for accurate inference at low computational costs, a wild bootstrap is proposed which injects simulated noise at an intermediate stage of data processing. This avoids to construct bootstrap raw samples, which can be quite infeasible when it comes to big data.
In various applications a change in the mean or variance resp. the second moment structure may render a method infeasible. Quite different problems were this issue arises is the construction of optimal portfolios and deep learning networks. Calculating an optimal portfolio based on a large universe of assets is expensive both in terms of computational costs as well as in trading costs. But as long as the portfolio does no change, which is the case if the second moments are constant, there is no need to update the portfolio. This motivates to monitor the stream of data and consider a procedure which signals when there is evidence for a change. In deep learning the problem is even worse. Training of a large neural network absorbs massive amounts of computational power and thus energy. We propose to monitor the network predictions to identify change-points indicating that the deep network is no longer optimal and needs to be trained with current data.
As challenging data science applications, the methods have been used to analyze spatial-temporal US climate data, [1], a sensor data set from industrial quality control publicly available at the UCL machine learning repository, [2], and to investigate the impact of the Covid-19 crisis on the well known Fama and French data, [3]. The frequency domain methods were applied to financial asset returns in [5].
Further activities:
Internal short course on "Data Stream Detection and Monitoring" (also held at UC Louvain, March 2020).
Related publications containing project results:
[1] Steland A. (2020). Testing and estimating a change-point in the covariance matrix of a high-dimensional time series. Journal of Multivariate Analysis, Volume 177.
[2] Mause N. and Steland A. (2020). Detecting changes in the second moment structure of high-dimensional sensor-type data in a K-sample setting, Sequential Analysis, Vol. 39, 336-366.
[3] Bours M. and Steland A. (2021). Large-sample approximations and change testing for high-dimensional covariance matrices of multivariate linear time series and factor models. Scandinavian Journal of Statistics, Vol. 48 (2), 610-654, [first published December 14th 2020.]
[4] Mies F. and Steland A. (2022). Sequential Gaussian Approximations for Nonstationary Time Series in High Dimensions, Bernoulli, Vol. 29(4), 3114-3140.
[5] Steland, A. (2024). Flexible nonlinear inference and change-point testing of high-dimensional spectral density matrices. Journal of Multivariate Analysis, Vol. 199, Article 215245.
[6] Mies F. and Steland A. (2024). Projection inference for high-dimensional covariance matrices with structured target. Electronic Journal of Statistics, Vol. 18(1), 1643-1676.
Dissemination by (Invited) Talks:
- Inference on the Second Moment Structure of High-Dimensional Sensor-Type Data in a K-Sample Setting, Workshop on Stochastic Models, Statistics and Their Applications (SMSA), TU Dresden, 2019.
- Asymptotics for High-Dimensional Covariance Matrices of Factor Models, Workshop on Stochastic Models, Statistics and Their Applications (SMSA), TU Dresden, 2019.
- Testing and Estimation of Change-Points in LSHD Data Streams: Asymptotics and Applications to Ozone Monitoring, invited talk @ Joined Statistical Meeting (JSM), Denver, CO, 2019.
- Multivariate Change-Point Asymptotics for Covariance Matrices of High-Dimensional Time Series, Workshop on Goodness-of-Fit, invited talk @ Change Point and Related Problems (GoFCP), Trento, Italy, 2019.
- Inference for High-Dimensional Covariance Matrices: Testing and Estimating Changes for Time Series, invited seminar talk @ Imperial College, London, 2019.
- Change Testing for High-Dimensional Econometric Factor Models, 4th International Conference on Econometrics and Statistics (EcoSta 2021), Hong Kong, 2021.
- Projection Inference for High-Dimensional Covariance Matrices with Structured Shrinkage Targets, CMStatistics 2022, London.
- Change-Point Testing of High-Dimensional Spectral Density Matrices, Invited Talk @ CMStatistics 2022, London.
- Sequential and Non-Sequential Methods for Common Mean Estimators (2014-2019)
Research cooperation with Prof. Yuan-Tsung Chang, Mejiro University, Tokio
In this long-term research collaboration we develop procedures for statistical inference based on estimators taking into account order information, focusing on common mean estimators. This is a classical problem, which allows to fuse existing data sets by combining associated summary statistics. Data sets with a common mean but different, ordered variances and perhaps even different distributional shapes arise in diverse fields. For example in interlaboratory experiments, on-site data collection of quality measurements with handheld devices or when processing data from image sensors or accelerometers, where the noise depends on temperature.
Uncertainty Estimation by the Jackknife:
Assessing the uncertainty (variability) in such data sets is a great concern and requires statistically sound methods, which are efficient from a computational point of view. We developed new jackknife resampling scheme for the relevant two-sample settings, which provides a versatile and highly efficient tool for data analysis. Our results also include two-sample statistics induced by differentiable statistical functionals as an abstract and general theoretical framework for the classical case of smooth statistics, as known results for jackknife variance estimation are limited to one sample settings. The results have been applied to real data from photovoltaics and industrial production. Data-based simulations reveal that confidence intervals for the mean power output of solar modules based on our jackknife variance estimators outperform existing approaches, such as standard asymptotics and Bayesian credible intervals, in terms of the accuracy of the coverage probability.
Sequential approach:
Big (massive) data can be distributed over many nodes of a network being too large for a single computer. Then each query may be associated with a substantial response time and data transmission costs. This rules out a classical data analysis of the whole sample as well as purely sequential methods where the number of queries are equal to the sample size. Two-stage procedures are a highly efficient statistical approaches, since they allow to draw data in two batches. Such a method draws a (relatively small) sample at the first stage und uses this information to calculate an optimal sample size which is then drawn and analyzed at the second stage.
We introduced a novel nonparametric approach for two-stage sampling to determine fixed-width uncertainty intervals for a parameter of interest when high confidence matters. This applies, for instance, to high-quality high-throughput production, statistical genetics and brain research. In these areas large confidence levels and small type I error rates are relevant in view of the large number of parameters one needs to assess. The new methodology is further developed to handle projected high-dimensional data and the classical problem of common mean estimation. Simulations show that the proposed algorithm performs well. Further, quality measurements from industrial quality control for manufactured electrical circuits (chips) have been analyzed to illustrate the method.
Further collaborator: Takenori Takahashi, Mejiro University and Keio University Graduate School.
Related publications:
[1] Steland, A. (2017). Fusing photovoltaic data for improved confidence intervals [Open Access]. AIMS Energy, 5 (1), 113-136.
[2] Steland, A. and Chang, Y.T. (2019). Jackknife variance estimation for common mean estimators under ordered variances and general two-sample statistics, accepted for publication in: Japanese Journal of Statistics and Data Science, http://arxiv.org/abs/1710.01898.
[3] Chang, Y.T. and Steland, A. (2021). High-confident nonparametric fixed-width uncertainty intervals and applications to projected high-dimensional data and common mean estimation, Sequential Analysis, 40 (1), 97-124, https://arxiv.org/abs/1910.02829.
- HIGH-DIMENSIONAL LARGE SAMPLE APPROXIMATIONS AND APPLICATIONS (2014-2018)
Research cooperation with Prof. Rainer von Sachs, Université catholique de Louvain, Belgium.
Our research on this topic is supported by a grant from Deutsche Forschungsgemeinschaft (DFG).

Related publications containing project results:
[1] Steland A. and von Sachs R. (2017). Large sample approximations for variance-covariance matrices of high-dimensional time series, Bernoulli, 23(4A), 2299-2329.
[2] Steland A. and von Sachs R. (2017). Asymptotics for high-dimensional covariance matrices and quadratic forms with applications to the trace functional and shrinkage, Stochastic Processes and Their Applications, 128(8), 2816-2855. https://arxiv.org/abs/1711.01835
[3] Steland A. (2018). Shrinkage for covariance estimation: Asymptotics, confidence intervals, bounds and applications in sensor monitoring and finance. Statisical Papers, 59 (4), 1441-1462. https://arxiv.org/abs/1809.00463
[4] Steland A. (2020). Testing and estimating a change-point in the covariance matrix of a high-dimensional time series. Journal of Multivariate Analysis, Vol. 170.
[5] Mause N. and Steland A. (2020). Detecting changes in the second moment structure of high-dimensional sensor-type data in a K-sample setting, Sequential Analysis, 39, 336-366.
[6] Bours M. and Steland A. (2021). Large-sample approximations and change testing for high-dimensional covariance matrices of multivariate linear time series and factor models. Scandinavian Journal of Statistics, 48 (2), 610-654, [first published online Dec. 2020].
December 14th 2020.]
accepted for publication.
Dissemination by invited talks:
- Large sample approximations for high-dimensional time series, IWSM 2015, New York City
- Large sample approximations for high-dimensional time series, ERCIM-CMStatistics 2015, London
- Large sample approximations for high-dimensional covariance matrices, Plenary Talk, ABAPAN Abstract and Applied Analysis 2016, Rome
- Detection of changes and inference for high-dimensional covariance matrices, ERCIM-CMStatistics 2016, Sevilla
- Inference for covariance matrices of high-dimensional time series, Plenary Talk, MAMECTIS 2017, Barcelona.
- Change Detection in High-Dimensional Covariance Matrices, 2017, Invited Talk, Keio University, Yokohama, Japan.
- Models and Procedures for the Analysis of High-Dimensional Time Series, Plenary Talk, Mathematical Models for Engineering Science (MMES), 2017, London, UK.
- Change Detection and Inference for High-Dimensional Covariance Matrices, Stochastic Processes and Their Applications SPA 2018, Gothenburg.
- Change Detection and Estimation for the Covariance Matrix of a High-Dimensional Time Series, CMStatistics 2018, Pisa.
- Inference for High-Dimensional Time Series Based on Bilinear Forms with Applications to Shrinkage, Statistics Festival, 2018, Ulm
- Large sample approximations for high-dimensional time series, IWSM 2015, New York City
- PV-SCAN: EVALUATION RESEARCH ON QUALITY CONTROL AND THE ASESSMENT OF SOLAR PANELS IN PHOTOVOLTAIC SYSTEMS (2013-2017)
(Evaluationsforschung zur Qualitätssicherung und -bewertung von PV-Modulen im Solarpark)
Collaborative Research Project (Verbundprojekt) PV-Scan of
- RWTH Aachen University
- International Solar Energy Research Center (ISC), Konstanz
- TÜV Rheinland Group, Cologne
- Solar-Fabrik, Freiburg (2013-2015)
- Sunnyside upP, Cologne (2013-2015)
- Wroclaw University of Technology (2015-2017, Associate Partner)
Project Leader @ RWTH: Prof. Dr. Ansgar Steland
Project at ISW: Tailor-Made Stochastic Models and Statistical Procedures for the Evaluation of Long-Term Quality and Technical Risks of PV systems.


This Energiewende-project is funded by

For further information visit The Photovoltaic Statistical Laboratory.
- Identification of neuromagnetic responses for real time analysis in magnetoencephalography (2012-)
Research cooperation with Forschungszentrum Jülich. - VARIABILITY-REDUCING QUALITY CONTROL METHODS IN PHOTOVOLTAICS (2010-2012)



 International Interdisciplinary Collaborative Project of
- RWTH Aachen University
- Wroclaw University of Technology
- AVANCIS GmbH & Co KG
- SolarWorld AG
- TÜV Rheinland Group (TÜV Rheinland Energie und Umwelt GmbH)
Project Coordinator: Prof. Dr. A. Steland, RWTH Aachen UniversityThis interdisciplinary research project aims to bring together mathematical and engineering expertise from academia and industry, in order to solve challenging problems appearing in photovoltaics - one of most promising technologies to solve the world's energy problem - by applying as well as extending appropriate mathematical methods.The research focuses on several topics. A major goal is to devel and study new stochastic acceptance sampling plans for photovoltaic data leading to smaller variances of the required sample size of control samples. Such methods allow both producers and consumers (end users) of photovoltaic modules to apply cost cutting stochastic sampling plans in the presence of much smaller flasher report tables than before. In the same vain, the planned reliability could be improved substantially. Here various methods ranging from classic nonparametric estimation to new approaches based on the singular spectrum analysis are investigated in detail, in order to figure out which methods perform best for the problem at hand. A further issue is to analyze whether those approaches carry over directly to the comparison of production sites, or whether external factors require more advanced solutions. A further question of interest is how to harmonize methods for collecting control measurements, particularly for the purpose of evaluation.Computer simulations on a larger scale are planned, firstly, to analyze in greater detail the available methods and, secondly, in order to clarify whether factors such as the technology (crystalline/thin-film) have to be taken into account when selecting the method.The project is financed by the Ministery for the Environment, Nature Conservation and Nuclear Safety.Publications:The following publications are strongly related to the project and/or provide results of the project:[1] Steland A., Herrmann W. (2010). Evaluation of Photovoltaic Modules Based on Sampling Inspection Using Smoothed Empirical Quantiles, Progress in Photovoltaics, 18 (1), 1-9.
[2] Meisen S., Pepelyshev A. and Steland A. (2012). Quality Assessment in the Presence of Additional Data, Frontiers in Statistical Quality Control, Voll. 9, in press.
[3] Golyandina A., Pepelyshev A. and Steland A. (2012). New approaches to nonparametric density estimation and selection of smoothing parameters, Computational Statistics and Data Analysis, 56(7), 2206-2218.
[4] Pepelyshev A., Rafajlowicz E. and Steland A. (2013). Estimation of the quantile function using Bernstein-Durrmeyer polynomials. Journal of Nonparametric Statistics, 26, 1, 1--20.
[5] Pepelyshev A., Steland A. and Avellan-Hampe A. (2014). Acceptance sampling plans for photovoltaic modules with two-sided specification limits. Progress in Photovoltaics, 22, 6, 603--611.
The following paper, related to the project, studies a two-sample test for distributions which may have different shapes. This problem arises when analyzing photovoltaic data sets taken in a sun simulator (flasher) or in a laboratory. Whereas the research project investigates methods to minimize the required number of observations, the new test studied in this paper can be used to compare such data sets. Its application is illustrated by analyzing real data from photovoltaics.
[4] Akram A., Padmanabhan P. and Steland A. (2011). Resampling methods for the nonparametric and generalized Behrens-Fisher problems. Sankhya Series A, Vol. 73-A-2, 267-302.
In a theoretical paper, to some extent motivated by our work on photovoltaic data, we studied the consistency of a data-adaptive strategy to choose a tuning constant of a detection method. Photovoltaic data was used to illustrate the method.
[5] Steland, A. (2011) Sequential Data-Adaptive Bandwidth Selection by Cross-Validation. Communications in Statistics Simulation and Computation, 41 (7), 1195-1219.
Talks:
[1] Steland, A. Quality Assessment in the Presence of Additional Data. Invited talk held at the 2010 ISQC workshop in Seattle, U.S.A.
[2] Pepelyshev, A. Golyandina, N. and Steland, A. A New Method of Nonparametric Density Estimation With Applications in Photovoltaics. Workshop on Stochastic Models and Their Applications 2011, Wismar, Germany.
[3] Steland, A. Quality Assessment in the Presence of Additional Data and Robustness Issues. Workshop on Stochastic Models and Their Applications 2011, Wismar, Germany.
[4] Steland, A. Functional Change-Point Asymptotics and Applications. World Statistics Congress of the International Statistical Institute (ISI), ISI 2011, Dublin, UK.
[5] Steland, A. Functional Change-Point Asymptotics and Applications in Finance and Renewable Energies. Annual Conference of the German Statistical Society 2011, Leipzig, Germany.
[6] Steland A. Ermittlung von repräsentativen Modulstichproben zur Leistungsmessung. Invited Tak given at the 9th Workshop Modultechnologie, Cologne, Germany.
- Structural Analysis and Detection of Anomalies in Airtraffic Data (2011)
In order to analyze binary variables collected in repeated air traffic surveys such as the quality of service or the customer type (business men or tourist), logistic regression models are an appropriate approach. However, there may be changes in the regression relationships due to economic events, technological factors or anomalies. For example, specific events such as crises (SARS, terror attacks or the recent financial crisis) may lead to such structural breaks.
Thus, in this research project we aim at developing new methods to detect structural changes (change-points) in binary regression relationships based on a sequential adapted GLM process. The new monitoring approach will be compared with other methodologies, analyzed by simulation studies and used to investigate real airtraffic data.
This research project is financed by a research grant from a leading international airport.
Talk:
[1] Lemken A., Steland, A. Detection of Anomalies in Binary Data. Annual Conference of the German Statistical Society 2011, Leipzig, Germany.
- Testing the Equality of Autocorrelations of Climate Processes (2011)
In this project we investigate a new test for the equality of the autocorrelation function, in order to analyze the spatial homogeneity of temporal dependencies of weather data of the Aachen region.
We kindly acknowledge our partner meteomedia for providing us with real high-frequency data.
- Statistical Visualization of Photovoltaic Quality Measurements - Software Design and Intelligent Data Analysis (10/08 - 12/08)

Project with TÜV Rheinland Immissionsschutz und Energiesysteme GmbH.
An important problem in photovoltaics is the statistical quality control of the power output of photovoltaic (PV) modules under standard conditions. Typically, the observations are non-normal, and in practice the visual evaluation of formal statistics and decision functions by means of appropriate graphics is necessary to validate the results. Relevant visualizations, e.g., nonparametric density estimates, depend on control parameters, which can be chosen manually by the user or determined according to mathematical optimality criteria. Careful experiments allow quality engineers to gain valuable insight into the distributional structure of the relevant data.
The project aims to design and implement appropriate problem-specific and customized nonparametric distributional estimators and corresponding visualizations. Furthermore, an intelligent adaptive statistical graphical user interface will be developed which integrates statistical algorithms and user interaction.
These features are implemented in our software APOS photovoltaic StatLab (Assessing the Power Output Specifications of PV modules), a tool for photovoltaic laboratories and the photovoltaic industry providing statistical support for the certification and quality evaluation of PV modules. It implements a multi-stage decision process which leads to substantially reduced sample sizes in many cases, thus reducing the costs substantially.
APOS photovoltaic StatLab is licensed by leading European and US-american photovoltaic laboratories and manufacturers. Please contact us.
A research version supports computers with multi-core processors by employing parallelized statistical algorithms. That provides better functionality and performance to analyze very large data sets. The programme runs on all major platforms.
Publications
[1] Herrmann W., Steland A. (2008). Poster (in German): Presentation of the methodology and
the software tool.[2] Herrmann W., Herff, W., Steland, A. (2009). Sampling procedures for the validation of PV
module output power specification. 24th European Photovoltaic Solar Energy Conference and Exhibition, Hamburg, Germany. Submitted.[3] Herrmann W., Herff, W., Steland, A. (2009). Poster: Sampling procedures for the validation of
PV module output power specification. 24th European Photovoltaic Solar Energy Conference and Exhibition, Hamburg, Germany.[4] Steland A., Herrmann W. (2010). Evaluation of Photovoltaic Modules Based on Sampling Inspection
Using Smoothed Empirical Quantiles, Progress in Photovoltaics, 18 (1), 1-9.Further publications are listed below.
- Methods and algorithms for statistical quality control of photovoltaic modules (04/07 - 12/07)

Project with TÜV Rheinland Immissionsschutz und Energiesysteme GmbH
The project aims to develop problem-specific stochastic methods to assess the quality of shipments of photovoltaic modules. Special emphasis is on the small to moderate sample size case and on statistically justified comparisons of flasherlist and laboratory data. The statistical behavior of the decision rules for parameter settings of practical relevance are studied by computer simulations.
Further information including all project documents can be found here.
The project has been funded by a grant from Solarverein Bayern e.V.
Software:
To foster dissemination of stochastic methods in the quality assessment of photovoltaic modules, efficient algorithms for methods developed in a previous project and a user-friendly graphical user interface are implemented in an expert software tool called APOS. To obtain a license or a demo version contact us.
Related Publications:
[1] Herrmann, W., Althaus, J., Steland, A. & Zähle, H. (2006). Statistical and experimental methods for
assessing the power output specification of PV modules. Proceedings of the 21st European Photovoltaic
Solar Energy Conference, 2416-2420.
[2] Steland, A. and Zähle H. (2009). Acceptance Sampling: Nonparametric Setting. Statistica Neerlandica,
Vol. 63, 1, 101-123. - Control charts with applications in image processing and industrial quality engineering (since 03/07)

Research project with Prof. E. Rafajlowicz, Technical University of Wroclaw, Poland.
We develop new sequential procedures based on control charts which allow to monitor sequences of images as arising in industrial quality control. To allow for on-line monitoring in real time we focus on procedures which are fast to compute.
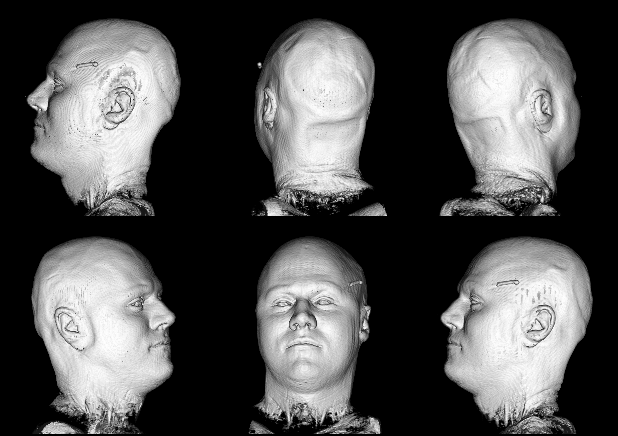
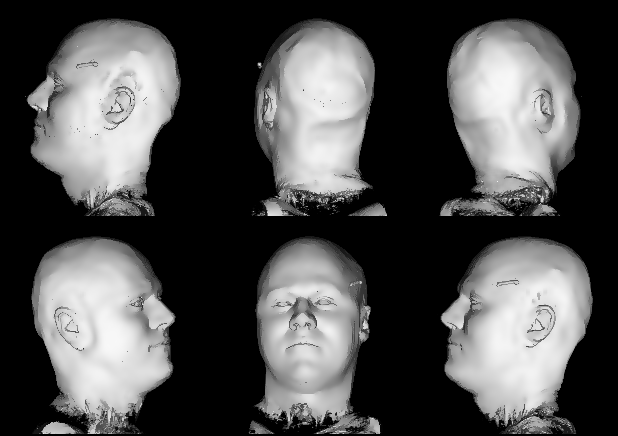
Our work is motivated by the problem to detect defects in material, e.g., cracks in copper, which result in lower quality, see [1]. In that paper we also discuss a nonlinear filtering approach, which simultaneously reduces the noise and preserves edges. The copper is surveyed by a camera taking several high-resolution images per second. These images have to be analyzed in real-time to detect the bubbles. Thus, computer-intensive methods are not feasible for that application.
For a simple but effective modified binary control chart we study the asymptotic distribution theory and investigate the statistical properties of the methods by simulation studies.
Illustration for the Public:
Here we applied a certain variant of our nonlinear filter to a more non-technical vivid example, a rendered head, which is easier to understand than images from real production processes. You see the effects and benefits of the filtering technique at a glance.
Publications:
The main results of our work are published in the following articles:
[1] Pawlak M., Rafajlowicz, E., and Steland A. (2008). Nonlinear image filtering and reconstruction: a unified approach based on vertically weighted regression. International Journal of Applied Mathematics and Computer Sciences, Vol. 18, 1, 49-61.
[2] Rafajlowicz, E. and Steland, A. (2008). A binary control chart to detect small jumps. Statistics, 43, 3, 295-311.[3] Pawlak, M., Rafajlowicz, E. & Steland, A. (2010). Nonparametric sequential change- points detection by a vertically trimmed box method. IEEE Transactions on Information Theory, 56 (7), 3621-3634.
- Robust Bootstrap Tests for Behrens-Fisher Type Problems With Applications to Sciences, Engineering, and Life Science

Research project with A.R. Padmanabhan (Monash University, Australia, and University Science Malaysia, Malaysia)
The Behrens-Fisher problem deals with the testing problem to decide wether two random samples differ in location. In many fields as engineering, physics, econometrics, biometrics, or psychology, the distributions are often skewed and even have different shapes. In this case classic procedures are no longer valid. Indeed, even the definition of 'equal in location' (equality of means, medians, ...) becomes a modeling task. We propose a definition which reduces to the (a) shift in the two sample location (shift) model and (b) the difference between the centers of symmetry in the nonparametric Behrens-Fisher model, under the additional assumption that the distributions are symmetric.
In the project we develop a new methodology for robust testing, derive rigorous bootstrap central limit theorems for the proposed statistics, develop appropriate software and investigate the properties by simulation studies. The new methodology can be used to analyze challenging data sets where the samples may even have different distributional shapes, such that classic tests are not applicable. It turns out that the resulting test is substantially superior to classic robust tests when the data follow a generalized extreme value distribution. This means that they are of particular interest in engineering as well as finance, where such data frequently arise.
The new methods are used to analyse several real data sets from electrical engineering, photovoltaics, astro physics (the classic Heyl and Cook measurements of the acceleration of gravity, and psychology.
We are grateful to R. Wilcox, University of Southern California, D. Rocke, University of California at Davis, and Dr. Werner Herrmann, TÜV Rheinland Group, for providing us with data sets.
Illustration for the Public:
Here you see a panel of so-called boxplots of three classic series of physical measurements of the acceleration of gravity (Heyl and Cook, 1936). The central box stands for the central 50% of the data points and the dotted lines end at the minimum and maximum, respectively. The bold horizontal line marks the median. That is the number which splits the data set in two parts: At least 50% of the measurements are smaller and at least 50% are larger than the median.
.jpg)
The boxplots show that these series exhibit inhomogeneity in their variances, and the second data set looks skewed. These characteristics complicate a statistical analysis considerably.
Steland, A., Padmanabhan, P., and Akram, M. (2011). Resampling methods for the nonparametric and generalized Behrens-Fisher problem . Sankhya Series A, 73-A, Vol. 2, 267-302.
- Stichprobenbasierte Labormessungen zur Leistungsbewertung von Solarmodulen (Juli 2006 - Dez 2006)

Projekt mit der TÜV Rheinland Immissionsschutz und Energiesysteme GmbH
End users and distributors of PV modules are faced with the problem of how to verify the power output specifications of a new shipment. Appropriate sampling plans and acceptance criteria are proposed under various distributional assumptions including the important case that additional information from a flasher report can be used to construct an acceptance function.
Publications:
[1] Herrmann, W., Althaus, J., Steland, A. & Zähle, H. (2006). Statistical and experimental methods for assessing the power output specification of PV modules. Proceedings of the 21st European Photovoltaic Solar Energy Conference, 2416-2420.
[2] Steland, A. and Zähle H. (2009). Acceptance Sampling: Nonparametric Setting. Statistica Neerlandica,
Vol. 63, 1, 101-123. - Nonparametric Process Control and Change-Point Analysis (2003-2006)


Mitarbeit im SFB-Projekt B1 ("Kapitalmarktpreise als Frühinidikatoren ökonomischer Strukturbrüche und Trends") des SFB 475 ("Komplexitätsreduktion in multivariaten Datenstrukturen"). Projektleiter: Krämer/Dette/Davies.
Contribution:
The quick detection of change-points (structural breaks) in time series is an important topic for the analysis of economic data, e.g., financial data from capital markets or the gross domestic product of an economy. New nonparametric monitoring procedures to detect changes in the mean of both stationary and non-stationary time series have been developed. Both the asymptotic distribution theory under various distributional assumptions covering important change-point models and the applicability of the resulting procedures have been studied.
Further, kernel based nonparametric methods to detect changes in the mean of a weakly dependent process have been investigated in several papers. Functional central limit theorems were established and applied to construct appropriate decision rules for real appplications. For a rich class of local alternatives the problem to determine an optimal smoothing kernel was solved successfully.
To address the question whether a time series is stationary I(0) or a I(1) random walk, new detection procedures for the related sequential testing problems have been developed and investigated. Such methods are of particular interest, because the economic interpretation of these models complete differs.
Illustration for the Public:
Here you see a time series which looks rather homogeneous. Visual inspection suggests to assume that the whole series is generated by the same stochastic model.
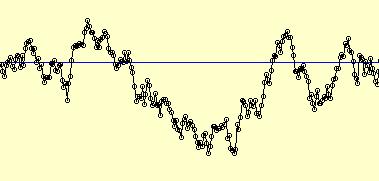
But this is wrong. The first 100 observations are generated by a so-called AR(1) model. At the change-point 100 the stochastic mechanism changes to a pure random walk. Trajectories from these two models can look rather similar in finite samples, but on the long run (in large samples) they behave completely different. If a time series changes its behavior, the decision problem to detect this change becomes even more difficult. We developed a new method for that problem which detects the change at obs. 161.Publications:
11 papers in international peer-reviewed journals. - Statistical Methods to Analyse Genetic Association Studies (2001-2005)


DFG-Projekt (Dette/Epplen/Steland).
An important statistical problem is the analysis of the genetic component of so-called complex diseases as, e.g., multiple sclerosis. The data consists of genotypes of certain candidate loci and a phenotyp. Whereas the statistical analysis of random samples of independent individuals is straightforward, appropriate methods to handle dependent family data, where genotypes and phenotypes are observed for parents and offsprings, are more recent. From a practical point of view it is interesting to start with a case-control design where a planned number of cases and controls are sampled. If this basic sample is enriched by genotypes and phenotypes of relatives, the number of cases and controls becomes random, since the phenotype of the relatives is random. Thus, standard statistical methods are no longer applicable.
In this interdisciplinary DFG-funded project we developed new parametric and nonparametric statistical tests to analyze data sets from case-control association studies of genetically induced dependent data. We established the required asymptotic distribution theory, and investigated extensively the finite sample properties by computer simulations.
- Statistische Äquivalenzuntersuchungen der Herzeffizienz (2005)

Beratungsprojekt mit OA Dr. O. Lindner, Institut für Radiologie, Nuklearmedizin und molekulare Bildgebung, Herz- und Diabeteszentrum NRW, Bad Oeynhausen.
- Sprungerhaltende Schätzverfahren und Kontrollkarten (2000-2005)
Forschungsprojekt mit Prof. Dr. habil. E. Rafajlowicz (Faculty of Electronics, Technical University Wroclaw) und Prof. M. Pawlak (Dept. of Engineering and Computer Science, University of Manitoba, Canada).
 Institut für Statistik und Wirtschaftsmathematik
| Webmaster: Hassan Satvat |






.jpeg)
